generalized Polynomial Chaos Expansion (gPCE)
Saleh Rezaeiravesh, salehr@kth.se SimEx/FLOW, Engineering Mechanics, KTH Royal Institute of Technology, Stockholm, Sweden
The aim of this notebook is to show how to use UQit for non-intrusive gPCE. In practice, we have the parameter samples and associated values of the model response. Therefore, we only want to construct the PCE and estimate statistical moments of the model function due to the variability of the uncertain parameters. This basically means much of the coding in the following examples is not required. Here, the extensive examples are provided to validate the implementation of the gPCE in UQit
for different combinations of parameters as well as different parameter dimensions. The validation is achieved through comparing the moments estimated by PCE with the reference values obtained either from analytical expressions or standard Monte-Carlo method.
[1]:
import os
import sys
import numpy as np
import math as mt
import matplotlib
import matplotlib.pyplot as plt
from UQit.pce import pce, pceEval, convPlot
import UQit.analyticTestFuncs as analyticTestFuncs
import UQit.write as writeUQ
import UQit.reshaper as reshaper
import UQit.sampling as sampling
Example 1: gPCE for one parameter with uniform distribution
Consider a model function \(f(q)\), where \(q\sim\mathcal{U}[a,b]\). The aim is to apply gPCE to estimate \(\mathbb{E}_q[f(q)]\) and \(\mathbb{V}_q[f(q)]\) and also construct a surrogate \(\tilde{f}(q)\).
In particular, we consider
which is implemented in analyticTestFuncs.fEx1D(qNodes,'type1'). The exact values of the mean and variance of this test function can be computed analytically and be used to validate the PCE estimations.
Step 1: Set the general settings
[2]:
distType='Unif'   #distribution type of the parameter
qInfo=[-2,4.0]    #parameter's admissible range
n=10              #number of training samples
nTest=200         #number of test samples in the parameter space
Set the PCE settings; we assume the training samples to be in the form of Gauss-Legendre nodes. The PCE coefficients are to be obtained by the Projection method. Alternatively one can choose the Regression method.
[3]:
sampleType='GQ'    #'GQ'=Gauss Quadrature nodes
                   #''= any other sample => only 'Regression' can be selected
pceSolveMethod='Projection' #'Regression': for any combination of sample points
                            #'Projection': only for GQ
Step 2: Put together the PCE information in pceDict. If some of the options are wrongly set by the user, pceDict_corrector will correct it.
[4]:
pceDict={'p':1,'sampleType':sampleType,'pceSolveMethod':pceSolveMethod,'distType':[distType]}
Step 3: Generate training samples. We choose the samples to be Gauss-Legendre nodes. Note that samples \(\{q^{(i)}\}_{i=1}^n \in \mathbb{Q}\) where \(\mathbb{Q}\) is qInfo, the admissible range of the parameter. Based on the gPCE rule, the polynomial bases are Legendre polynomials defined over the mapped space \(\Gamma=[-1,1]\). Therefore corresponding to each \(q^{(i)}\), there is a unique \(\xi^{(i)}\in\Gamma\).
[5]:
samps=sampling.trainSample(sampleType=sampleType,GQdistType=distType,qInfo=qInfo,nSamp=n)
q=samps.q       #training samples in the original parameter space
xi=samps.xi     #training samples in the mapped parameter space
qBound=samps.qBound  #admissible range of the parameter
Step 4: Run the simulators at the training samples.
[6]:
fEx=analyticTestFuncs.fEx1D(q,'type1',qInfo)
f=fEx.val
Step 5 Construct the PCE, given the training data.
[7]:
pce_=pce(fVal=f,xi=xi[:,None],pceDict=pceDict)
fMean=pce_.fMean     #E[f(q)] estimated by PCE
fVar=pce_.fVar       #V[f(q)] estimated by PCE
pceCoefs=pce_.coefs  #Coefficients of the PCE
The outputs are the coefficients in the PCE along with the estimated \(\mathbb{E}_q[f(q)]\) and \(\mathbb{V}_q[f(q)]\).
Compute the exact moments of f(q), as the reference values
[8]:
fEx.moments(qInfo)
fMean_ex=fEx.mean
fVar_ex=fEx.var
Step 6: Validate the PCE_estimated moments with associated analytical values.
[9]:
print('--------- Exact --------- PCE ---- Error % ')
print('E[(q)] = %g\t%g\t%g' %(fMean_ex,fMean,(fMean-fMean_ex)/fMean_ex*100.))
print('V[f(q)] = %g\t%g\t%g' %(fVar_ex,fVar,(fVar-fVar_ex)/fVar_ex*100.))
--------- Exact --------- PCE ---- Error %
E[(q)] = 10.0471        10.056  0.0882092
V[f(q)] = 4.91876       5.05353 2.73999
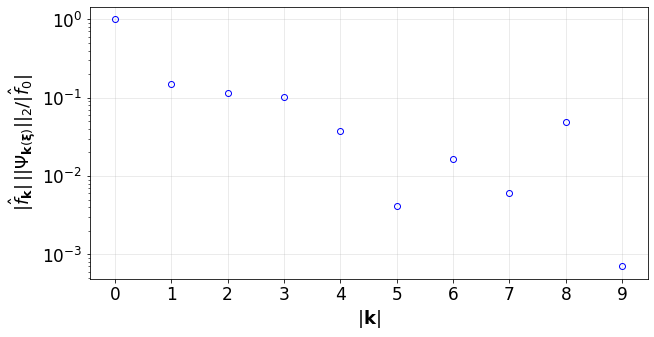
Plot the convergence of the PCE terms:
[10]:
convPlot(coefs=pceCoefs,distType=distType)
[10]:
<UQit.pce.convPlot at 0x7f3381d72c90>
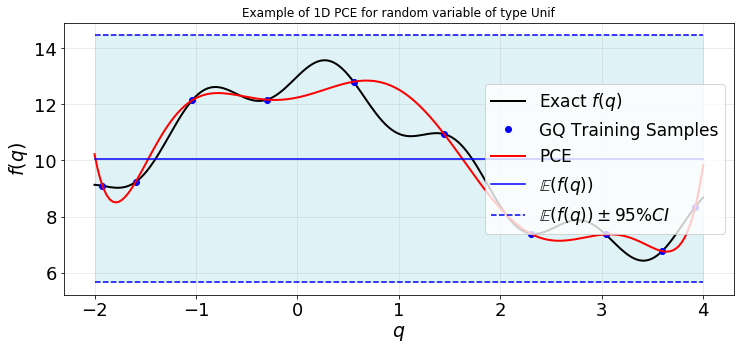
Step 7: Visually compare the PCE surrogate with the actual simulator at a set of test samples taken from the considered parameter range. First, we generate test points and the value of the simulator.
[11]:
testSamps=sampling.testSample('unifSpaced',GQdistType=distType,qInfo=qInfo,qBound=qBound,nSamp=nTest)
qTest=testSamps.q
xiTest=testSamps.xi
fTest=analyticTestFuncs.fEx1D(qTest,'type1',qInfo).val   #exact response at test samples
Evaluate the constructed PCE at the test points.
[12]:
pcePred_=pceEval(coefs=pceCoefs,xi=[xiTest],distType=[distType])
fPCE=pcePred_.pceVal
Plot the PCE and exact values:
[13]:
def plot1d(qTest,fTest,q,f,fPCE,fMean,fVar):
    plt.figure(figsize=(12,5))
    ax=plt.gca()
    plt.plot(qTest,fTest,'-k',lw=2,label=r'Exact $f(q)$')
    plt.plot(q,f,'ob',label=sampleType+' Training Samples')
    plt.plot(qTest,fPCE,'-r',lw=2,label='PCE')
    plt.plot(qTest,fMean*np.ones(len(qTest)),'-b',label=r'$\mathbb{E}(f(q))$')
    ax.fill_between(qTest,fMean+1.96*mt.sqrt(fVar)*np.ones(len(qTest)),fMean-1.96*mt.sqrt(fVar)*np.ones(len(qTest)),color='powderblue',alpha=0.4)
    plt.plot(qTest,fMean+1.96*mt.sqrt(fVar)*np.ones(len(qTest)),'--b',label=r'$\mathbb{E}(f(q))\pm 95\%CI$')
    plt.plot(qTest,fMean-1.96*mt.sqrt(fVar)*np.ones(len(qTest)),'--b')
    plt.title('Example of 1D PCE for random variable of type %s' %distType)
    plt.xlabel(r'$q$',fontsize=19)
    plt.ylabel(r'$f(q)$',fontsize=19)
    plt.xticks(fontsize=18)
    plt.yticks(fontsize=18)
    plt.grid(alpha=0.3)
    plt.legend(loc='best',fontsize=17)

plot1d(qTest,fTest,q,f,fPCE,fMean,fVar)
Example 2: gPCE for a parameter with uniform distribution
Repeat Example 1, with the parameter samples being chosen not as Gauss-Legendre nodes. Also use the total-order truncation scheme. For these settings, the regression method is used to compute the PCE coefficients. The distribution type and admissible range of the parameter are the same as the previous example.
[14]:
n=30              #number of training samples
#PCE Settings
sampleType='unifRand'
pceSolveMethod='Regression'
LMax=40           #maximum polynomial order in the total-order truncation
[15]:
#(0) Make the pceDict
pceDict={'p':1,'sampleType':sampleType,'pceSolveMethod':pceSolveMethod,'LMax':LMax,
         'distType':[distType]}
#(1) Generate training data
samps=sampling.trainSample(sampleType=sampleType,GQdistType=distType,qInfo=qInfo,nSamp=n)
q=samps.q
xi=samps.xi
qBound=samps.qBound
fEx=analyticTestFuncs.fEx1D(q,'type1',qInfo)
f=fEx.val
#(2) Construct the PCE
pce_=pce(fVal=f,xi=xi[:,None],pceDict=pceDict)
fMean=pce_.fMean     #E[f(q)] estimated by PCE
fVar=pce_.fVar       #V[f(q)] estimated by PCE
pceCoefs=pce_.coefs  #Coefficients in the PCE
...... Number of terms in PCE, K=  40
...... Number of Data point, n=  30
-----------------------------------------------------------------
           OSQP v0.6.0  -  Operator Splitting QP Solver
              (c) Bartolomeo Stellato,  Goran Banjac
        University of Oxford  -  Stanford University 2019
-----------------------------------------------------------------
problem:  variables n = 80, constraints m = 120
          nnz(P) + nnz(A) = 1760
settings: linear system solver = qdldl,
          eps_abs = 1.0e-05, eps_rel = 1.0e-05,
          eps_prim_inf = 1.0e-04, eps_dual_inf = 1.0e-04,
          rho = 1.00e-01 (adaptive),
          sigma = 1.00e-06, alpha = 1.60, max_iter = 100000
          check_termination: on (interval 25),
          scaling: on, scaled_termination: off
          warm start: on, polish: on, time_limit: off

iter   objective    pri res    dua res    rho        time
   1  -3.2000e+02   2.85e+02   1.03e+05   1.00e-01   2.57e-04s
 200   2.7810e+01   3.93e-02   5.00e-04   1.68e-02   1.40e-03s
 400   2.7879e+01   1.29e-02   6.93e-05   1.68e-02   2.50e-03s
 600   2.7869e+01   1.20e-02   1.44e-04   1.68e-02   3.62e-03s
 800   2.7901e+01   9.54e-03   1.12e-03   1.27e-01   4.77e-03s
1000   2.7962e+01   4.29e-03   6.40e-04   1.27e-01   5.87e-03s
1200   2.7962e+01   1.12e-02   5.96e-04   2.27e-02   7.02e-03s
1400   2.8120e+01   4.35e-03   5.33e-05   2.27e-02   8.13e-03s
1550   2.8108e+01   2.39e-03   1.13e-05   2.27e-02   8.96e-03s

status:               solved
solution polish:      unsuccessful
number of iterations: 1550
optimal objective:    28.1077
run time:             9.17e-03s
optimal rho estimate: 4.57e-02

...... Compressed sensing (regularization) is done.
       Min objective value=||fHat||= 28.1077 in L1-sense.
Note that if the chosen LMax is larger than n, then the compressed sensing method is called which may happen that does not converge.
[16]:
#(3) Compare moments: exact vs. PCE estimations
print('-------------- Exact -------- PCE --------- Error % ')
print('Mean of f(q) = %g\t%g\t%g' %(fMean_ex,fMean,(fMean-fMean_ex)/fMean_ex*100.))
print('Var  of f(q) = %g\t%g\t%g' %(fVar_ex,fVar,(fVar-fVar_ex)/fVar_ex*100.))
-------------- Exact -------- PCE --------- Error %
Mean of f(q) = 10.0471  9.26149 -7.81967
Var  of f(q) = 4.91876  4.80895 -2.23238
[17]:
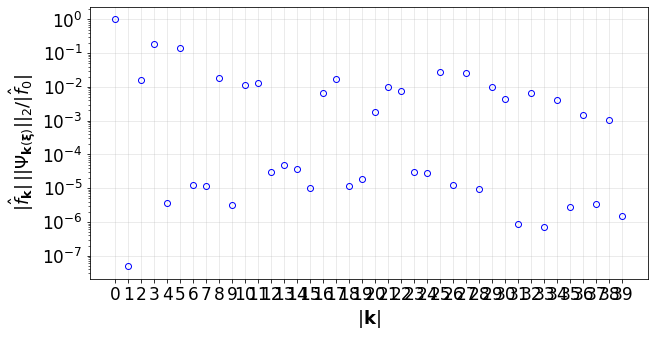
#(4) Plot the convergence of the PCE terms:
convPlot(coefs=pceCoefs,distType=distType)
[17]:
<UQit.pce.convPlot at 0x7f33801e0490>
Plot the response surface
[18]:
plot1d(qTest,fTest,q,f,fPCE,fMean,fVar)
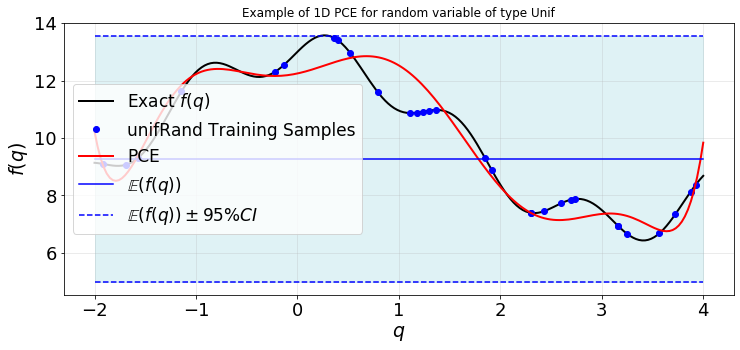
You can compare the accuracy of the estimated moments of \(f(q)\) and the constructed surrogate to what we got in Example 1.
Extra: 1. Try to change the number of trainging samples and look at the convergence of the estimated moments and also above the deviation between the exact response and surrogate (above figure). 2. Change LMax and see how it impacts the outputs. 3. Try different types of training samples unifSpaced, GLL, unifRand, … .
Example 3: gPCE for a parameter with Gaussian distribution
Consider \(q\sim\mathcal{N}(m,v^2)\), where \(m\) and \(v\) are known and constant. We want to use gPCE method to estimate the mean and variance of the following model function,
which is available in UQit as analyticTestFuncs.fEx1D(q,'type2'). The exact values of the mean and variance of this test function have been implemented in UQit and can be used to validate the PCE estimations.
[19]:
#Settings
distType='Norm'      #distribution type of the parameter
qInfo=[2,0.9]       #[m,v] for 'Norm' q~N(m,v^2)
#PCE settings
n=15                 #number of training samples
nTest=200            #number of test sample sin the parameter space
sampleType='GQ'      #'GQ'=Gauss Quadrature nodes
                     #'normRand'= Random samples from the given Gaussian distribution
                     # see `trainSample` class in sampling.py
pceSolveMethod='Projection' #'Regression': for any combination of sample points
                            #'Projection': only for GQ
LMax_=50            #(Only used Regresson method)
[20]:
#(0) Make the pceDict
pceDict={'p':1,'sampleType':sampleType,'pceSolveMethod':pceSolveMethod,'LMax':LMax_,
        'distType':[distType]}
#(1) Generate training data
samps=sampling.trainSample(sampleType=sampleType,GQdistType=distType,qInfo=qInfo,nSamp=n)
q=samps.q
xi=samps.xi
qBound=samps.qBound
fEx=analyticTestFuncs.fEx1D(q,'type2',qInfo)
f=fEx.val
#(2) Compute the exact moments (as the reference data)
fEx.moments(qInfo)
fMean_ex=fEx.mean
fVar_ex=fEx.var
#(3) Construct the PCE
pce_=pce(fVal=f,xi=xi[:,None],pceDict=pceDict)
fMean=pce_.fMean     #E[f(q)] estimated by PCE
fVar=pce_.fVar       #V[f(q)] estimated by PCE
pceCoefs=pce_.coefs  #Coefficients in the PCE
Compare moments: exact vs. PCE estimations
[21]:
print('----------------- Exact ----- PCE --------- Error % ')
print('Mean of f(q) = %g\t%g\t%g' %(fMean_ex,fMean,(fMean-fMean_ex)/fMean_ex*100.))
print('Var  of f(q) = %g\t%g\t%g' %(fVar_ex,fVar,(fVar-fVar_ex)/fVar_ex*100.))
----------------- Exact ----- PCE --------- Error %
Mean of f(q) = 0.197899 0.197899        5.15003e-11
Var  of f(q) = 0.461603 0.461608        0.00111709
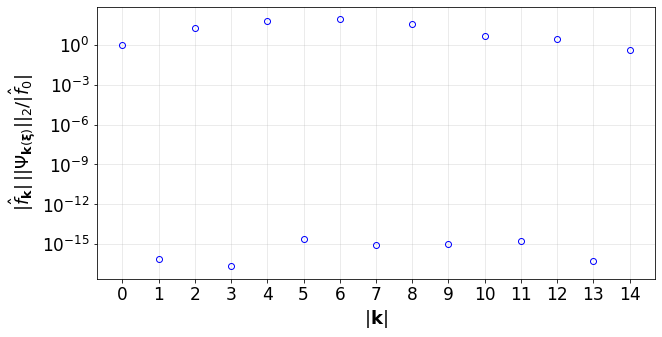
Convergence of the PCE terms
[22]:
convPlot(coefs=pceCoefs,distType=distType)
[22]:
<UQit.pce.convPlot at 0x7f338044d9d0>
Evaluate the PCE at test samples and plot the response surface
[23]:
testSamps=sampling.testSample('unifSpaced',GQdistType=distType,qInfo=qInfo,qBound=qBound,nSamp=nTest)
qTest=testSamps.q
xiTest=testSamps.xi
fTest=analyticTestFuncs.fEx1D(qTest,'type2',qInfo).val   #exact response at test samples
#Prediction by PCE at test samples
pcePred_=pceEval(coefs=pceCoefs,xi=[xiTest],distType=[distType])
fPCE=pcePred_.pceVal
#plot
plot1d(qTest,fTest,q,f,fPCE,fMean,fVar)
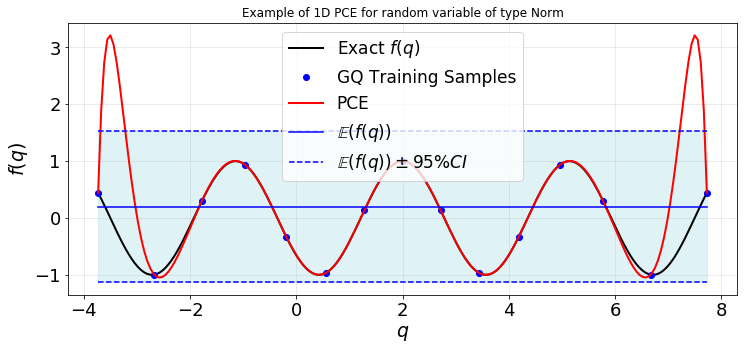
Note that despite the descrepancy between the PCE and exact response surface, the mean and variance of the model function can be estimated accurately by the PCE.
Example 4: gPCE for 2 parameters with different distributions
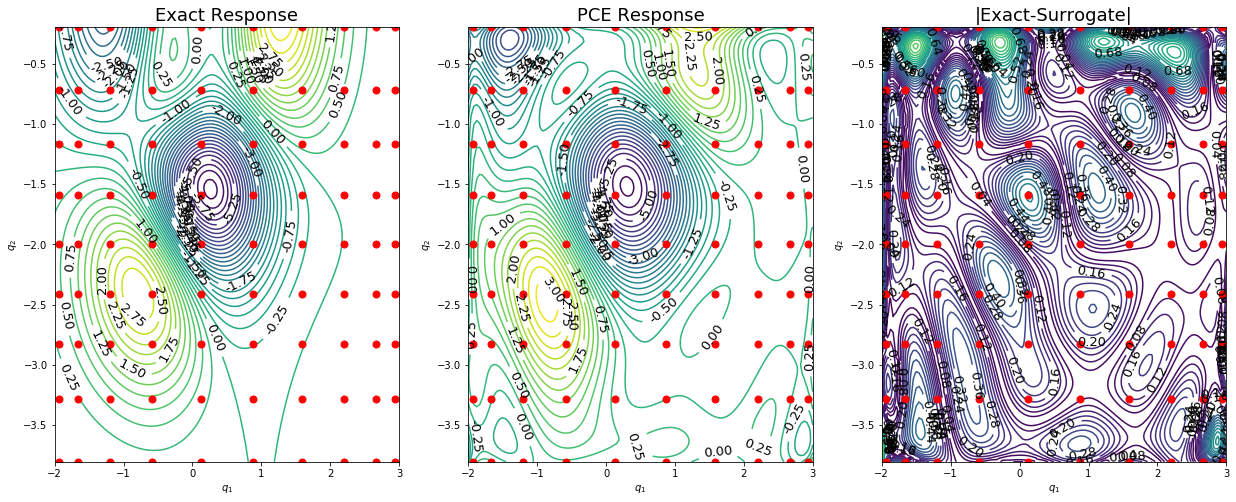
Let \(q_1\) and \(q_2\) be two independent uncertain parameters with known distributions. Also, consider a model function \(f(q_1,q_2)\) as the simulator. In analyticTestFuncs.fEx2D(q1,q2,typ,method) for typ equal to 'type1', 'type2', 'type3', and 'Rosenbrock', we have different functional form implemented for \(f(q_1,q_2)\). We use UQit to construct a gPCE over the tensor-product space \(\mathbb{Q}_1\bigotimes \mathbb{Q}_2\). The mean and variance
of \(f(q_1,q_2)\) estimated by gPCE are compared to the values directly estimated by pure Monte-Carlo method.
First, we set the specifications of the parameters and the options for PCE. It is recalled that if a parameter is uniformly distributed, then qInfo specifies the admissible range \(\mathbb{Q}\) of that parameter. But, if a parameter is Gaussian, then qInfo=[m,v] corresponds to \(\mathcal{N}(m,v^2)\).
[24]:
#Parameters specifications
distType=['Unif','Norm']   #distribution type of the parameters q1, q2
qInfo=[[-2,3],             #info on parameters
       [-2,0.4]]
nQ=[10,9]                   #number of training samples of parameters
nTest=[121,120]            #number of test points in parameter spaces to evaluate PCE
#PCE Options
truncMethod='TO'     #'TP'=Tensor Product
                     #'TO'=Total Order
sampleType=['GQ','GQ']  #'GQ'=Gauss Quadrature nodes ('Projection' or 'Regression')
                        #For other type of samples, see sampling.py, trainSample => only 'Regression' can be used
                        #'LHS': Latin Hypercube Sampling (only when all distType='Unif')
fType='type1'#Type of the exact model response, 'type1', 'type2', 'type3', 'Rosenbrock'
pceSolveMethod='Regression' #'Regression': for any combination of sampling and truncation methods
                            #'Projection': only for 'GQ'+'TP'
if truncMethod=='TO':
   LMax=9   #max polynomial order in each parameter dimention
Assemble the pce dictionary:
[25]:
p=len(distType)
pceDict={'p':p,'truncMethod':truncMethod,'sampleType':sampleType,
            'pceSolveMethod':pceSolveMethod,'distType':distType}
if truncMethod=='TO':
   pceDict.update({'LMax':LMax,'pceSolveMethod':'Regression'})
Generate the training data
[26]:
q=[]
xi=[]
qBound=[]
for i in range(p):
    samps=sampling.trainSample(sampleType=sampleType[i],
                   GQdistType=distType[i],qInfo=qInfo[i],nSamp=nQ[i])
    q.append(samps.q)
    xi.append(samps.xi)
    qBound.append(samps.qBound)
fEx_=analyticTestFuncs.fEx2D(q[0],q[1],fType,'tensorProd')
fVal=fEx_.val
xiGrid=reshaper.vecs2grid(xi)
Construct the PCE
[27]:
pce_=pce(fVal=fVal,xi=xiGrid,pceDict=pceDict,nQList=nQ)
fMean=pce_.fMean
fVar=pce_.fVar
pceCoefs=pce_.coefs
kSet=pce_.kSet
... A gPCE for a 2-D parameter space is constructed.
...... PCE truncation method: TO
...... Method of computing PCE coefficients: Regression
         with LMax=9 as the max polynomial order in each direction.
...... Number of terms in PCE, K=  55
...... Number of Data point, n=  90
-----------------------------------------------------------------
           OSQP v0.6.0  -  Operator Splitting QP Solver
              (c) Bartolomeo Stellato,  Goran Banjac
        University of Oxford  -  Stanford University 2019
-----------------------------------------------------------------
problem:  variables n = 110, constraints m = 165
          nnz(P) + nnz(A) = 3217
settings: linear system solver = qdldl,
          eps_abs = 1.0e-05, eps_rel = 1.0e-05,
          eps_prim_inf = 1.0e-04, eps_dual_inf = 1.0e-04,
          rho = 1.00e-01 (adaptive),
          sigma = 1.00e-06, alpha = 1.60, max_iter = 100000
          check_termination: on (interval 25),
          scaling: on, scaled_termination: off
          warm start: on, polish: on, time_limit: off

iter   objective    pri res    dua res    rho        time
   1  -4.4000e+02   1.12e+05   4.59e+07   1.00e-01   6.62e-04s
 125   1.6933e+01   6.11e-01   8.24e-07   1.00e-01   2.33e-03s

status:               solved
solution polish:      unsuccessful
number of iterations: 125
optimal objective:    16.9331
run time:             2.92e-03s
optimal rho estimate: 6.28e+00

...... Compressed sensing (regularization) is done.
       Min objective value=||fHat||= 16.9331 in L1-sense.
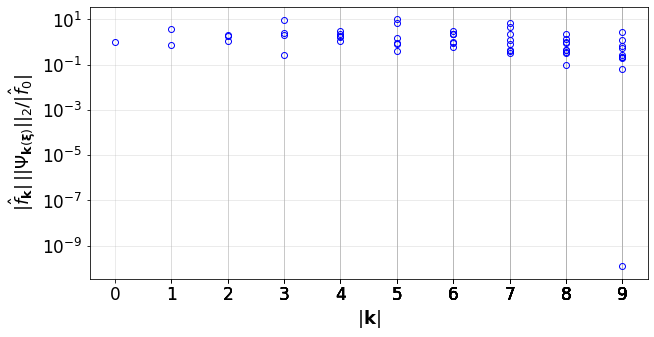
Plot the convergence indicator of the PCE
[28]:
convPlot(coefs=pceCoefs,distType=distType,kSet=kSet)
[28]:
<UQit.pce.convPlot at 0x7f3373ac1550>
Use MC method to directly estimate reference values for the mean and varaiance of \(f(\mathbf{q})\)
[29]:
fEx_.moments(distType,qInfo)
fMean_mc=fEx_.mean
fVar_mc=fEx_.var
... Reference moments are calculated by the Monte-Carlo method with 100000 samples
Generate test samples for the parameters and evaluate the exact response surface and the constructed PCE at them
[30]:
def testSamps2d(p,distType,qInfo,qBound,nTest):
    qTest=[]
    xiTest=[]
    for i in range(p):
        testSamps=sampling.testSample('unifSpaced',GQdistType=distType[i],
                    qInfo=qInfo[i],qBound=qBound[i],nSamp=nTest[i])
        qTest_=testSamps.q
        xiTest_=testSamps.xi
        qTest.append(qTest_)
        xiTest.append(xiTest_)
    fTest=analyticTestFuncs.fEx2D(qTest[0],qTest[1],fType,'tensorProd').val
    return xiTest,qTest,fTest
xiTest,qTest,fTest=testSamps2d(p,distType,qInfo,qBound,nTest)
#Evaluate PCE at the test samples
pcePred_=pceEval(coefs=pceCoefs,xi=xiTest,distType=distType,kSet=kSet)
fPCE=pcePred_.pceVal
Compare the PCE estimates for the moments of f(q) with the reference values obtained from the Monte-Carlo method
[31]:
print('------------ MC -------- PCE --------- Error % ')
print('Mean of f(q) = %g\t%g\t%g' %(fMean_mc,fMean,(fMean-fMean_mc)/fMean_mc*100.))
print('Var  of f(q) = %g\t%g\t%g' %(fVar_mc,fVar,(fVar-fVar_mc)/fVar_mc*100.))
------------ MC -------- PCE --------- Error %
Mean of f(q) = -0.497883        -0.504892       1.40791
Var  of f(q) = 3.75728  3.54174 -5.73658
Clearly, we see how the use of the gPCE with much fewer number of samples compared to Monte-Carlo approach, will result in the accurate estimates for the \(\mathbb{E}[f(q_1,q_2)]\) and \(\mathbb{V}[f(q_1,q_2)]\).
Make contour plots of the response surfaces
[32]:
def plot2d(nTest,qTest,fTest,q,fPCE):
    # Create 2D grid from the test samples and plot the contours of response surface over it
    fTestGrid=fTest.reshape(nTest,order='F')
    fErrorGrid=(abs(fTestGrid-fPCE))
    # 2D grid from the sampled parameters
    if sampleType[0]=='LHS' and sampleType[1]=='LHS':
       qGrid=reshaper.vecsGlue(q[0],q[1])
    else:
       qGrid=reshaper.vecs2grid(q)
    plt.figure(figsize=(21,8));
    plt.subplot(1,3,1)
    ax=plt.gca()
    CS1 = plt.contour(qTest[0],qTest[1],fTestGrid.T,40)
    plt.clabel(CS1, inline=True, fontsize=13,colors='k',fmt='%0.2f',rightside_up=True,manual=False)
    plt.plot(qGrid[:,0],qGrid[:,1],'o',color='r',markersize=7)
    plt.xlabel(r'$q_1$');plt.ylabel(r'$q_2$')
    plt.title('Exact Response',fontsize=18)
    plt.subplot(1,3,2)
    ax=plt.gca()
    CS2 = plt.contour(qTest[0],qTest[1],fPCE.T,40)
    plt.clabel(CS2, inline=True, fontsize=13,colors='k',fmt='%0.2f',rightside_up=True,manual=False)
    plt.plot(qGrid[:,0],qGrid[:,1],'o',color='r',markersize=7)
    plt.xlabel(r'$q_1$');plt.ylabel(r'$q_2$')
    plt.title('PCE Response',fontsize=18)
    plt.subplot(1,3,3)
    ax=plt.gca()
    CS3 = plt.contour(qTest[0],qTest[1],fErrorGrid.T,40)
    plt.clabel(CS3, inline=True, fontsize=13,colors='k',fmt='%0.2f',rightside_up=True,manual=False)
    plt.xlabel(r'$q_1$');plt.ylabel(r'$q_2$')
    plt.plot(qGrid[:,0],qGrid[:,1],'o',color='r',markersize=7)
    plt.title('|Exact-Surrogate|',fontsize=18)
    plt.show()

plot2d(nTest,qTest,fTest,q,fPCE)
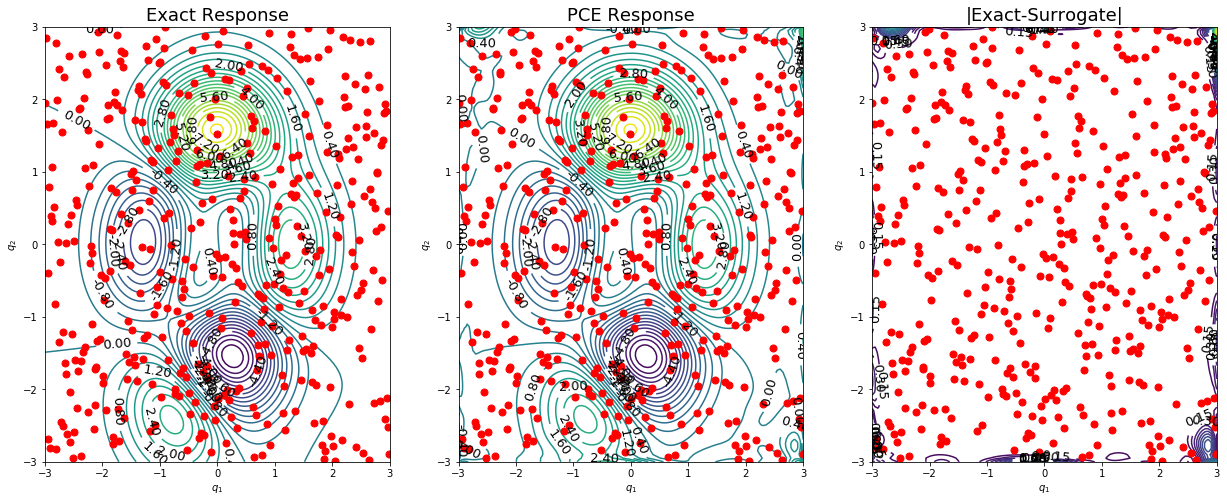
Now, let’s assume both parameters are uniformly distributed and use Latin-Hypercube Sampling (LHS). In this case, the number of samples becomes equal to nQ[0]*nQ[1]. The purpose of this example is to show we can use random parameter samples and large number of terms in the PCE. We need to do the following modifications in the settings:
[33]:
distType=['Unif','Unif']     #distribution type of the parameters q1, q2
sampleType=['LHS','LHS']
qInfo=[[-3,3],               #info on parameters
       [-3,3]]
nQ=[20,22]                   #number of training samples of parameters
if truncMethod=='TO':
   LMax=35   #max polynomial order in each parameter dimention
The pceDict is updated due to the new inputs:
[34]:
p=len(distType)
pceDict={'p':p,'truncMethod':truncMethod,'sampleType':sampleType,
            'pceSolveMethod':pceSolveMethod,'distType':distType}
if truncMethod=='TO':
   pceDict.update({'LMax':LMax,'pceSolveMethod':'Regression'})
We can generate the training samples as:
[35]:
q=[]
qBound=qInfo
xi=sampling.LHS_sampling(nQ[0]*nQ[1],[[-1,1]]*p)
for i in range(p):
    q.append(pce.mapFromUnit(xi[:,i],qBound[i]))
fEx_=analyticTestFuncs.fEx2D(q[0],q[1],fType,'comp')
fVal=fEx_.val
xiGrid=xi
The PCE is constructed exactly as above:
[36]:
pce_=pce(fVal=fVal,xi=xiGrid,pceDict=pceDict,nQList=nQ)
fMean=pce_.fMean
fVar=pce_.fVar
pceCoefs=pce_.coefs
kSet=pce_.kSet
... A gPCE for a 2-D parameter space is constructed.
...... PCE truncation method: TO
...... Method of computing PCE coefficients: Regression
         with LMax=35 as the max polynomial order in each direction.
...... Number of terms in PCE, K=  666
...... Number of Data point, n=  440
-----------------------------------------------------------------
           OSQP v0.6.0  -  Operator Splitting QP Solver
              (c) Bartolomeo Stellato,  Goran Banjac
        University of Oxford  -  Stanford University 2019
-----------------------------------------------------------------
problem:  variables n = 1332, constraints m = 1998
          nnz(P) + nnz(A) = 446218
settings: linear system solver = qdldl,
          eps_abs = 1.0e-05, eps_rel = 1.0e-05,
          eps_prim_inf = 1.0e-04, eps_dual_inf = 1.0e-04,
          rho = 1.00e-01 (adaptive),
          sigma = 1.00e-06, alpha = 1.60, max_iter = 100000
          check_termination: on (interval 25),
          scaling: on, scaled_termination: off
          warm start: on, polish: on, time_limit: off

iter   objective    pri res    dua res    rho        time
   1  -5.3280e+03   1.52e+02   3.27e+04   1.00e-01   2.13e-01s
 200   8.9141e+01   2.09e-02   1.82e-03   1.00e-01   4.63e-01s
 400   8.9737e+01   1.04e-02   6.12e-04   1.00e-01   7.21e-01s
 600   8.9962e+01   6.02e-03   5.81e-04   1.00e-01   9.78e-01s
 800   9.0114e+01   3.94e-03   2.68e-04   1.00e-01   1.23e+00s
1000   9.0178e+01   3.27e-03   1.67e-04   1.00e-01   1.55e+00s
1200   9.0217e+01   2.63e-03   1.52e-04   1.00e-01   1.88e+00s
1400   9.0258e+01   2.38e-03   1.81e-04   1.00e-01   2.24e+00s
1600   9.0273e+01   2.41e-03   1.25e-04   1.00e-01   2.53e+00s
1800   9.0291e+01   1.63e-03   9.86e-05   1.00e-01   2.88e+00s
2000   9.0306e+01   1.90e-03   9.59e-05   1.00e-01   3.24e+00s
2200   9.0320e+01   1.27e-03   1.65e-04   1.00e-01   3.54e+00s
2400   9.0332e+01   1.56e-03   8.73e-05   1.00e-01   3.88e+00s
2600   9.0339e+01   1.15e-03   5.46e-05   1.00e-01   4.17e+00s
2800   9.0341e+01   1.35e-03   5.15e-05   1.00e-01   4.43e+00s
3000   9.0342e+01   1.12e-03   4.26e-05   1.00e-01   4.68e+00s
3200   9.0346e+01   1.19e-03   4.54e-05   1.00e-01   4.94e+00s
3400   9.0349e+01   9.30e-04   4.08e-05   1.00e-01   5.19e+00s
3600   9.0357e+01   8.77e-04   5.06e-05   1.00e-01   5.45e+00s
3800   9.0355e+01   9.65e-04   3.92e-05   1.00e-01   5.70e+00s
4000   9.0354e+01   8.83e-04   3.66e-05   1.00e-01   5.96e+00s
4200   9.0360e+01   8.21e-04   3.25e-05   1.00e-01   6.20e+00s
4400   9.0360e+01   7.91e-04   3.21e-05   1.00e-01   6.45e+00s
4600   9.0360e+01   7.32e-04   2.72e-05   1.00e-01   6.70e+00s
4775   9.0363e+01   7.63e-04   1.31e-05   1.00e-01   6.95e+00s

status:               solved
solution polish:      unsuccessful
number of iterations: 4775
optimal objective:    90.3626
run time:             7.15e+00s
optimal rho estimate: 2.28e-01

...... Compressed sensing (regularization) is done.
       Min objective value=||fHat||= 90.3626 in L1-sense.
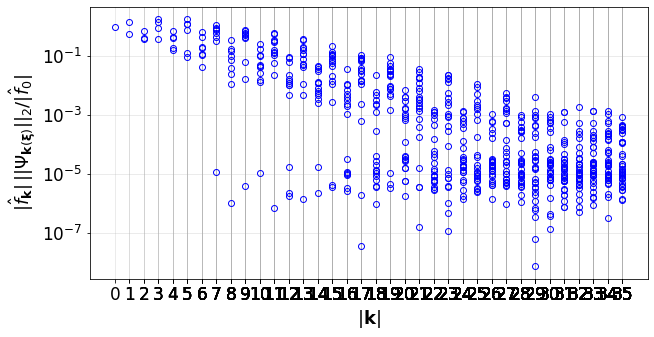
The convergence of the PCE terms:
[37]:
convPlot(coefs=pceCoefs,distType=distType,kSet=kSet)
[37]:
<UQit.pce.convPlot at 0x7f3372d1ad90>
Let’s evaluate the constructed PCE at the test samples
[38]:
xiTest,qTest,fTest=testSamps2d(p,distType,qInfo,qBound,nTest)
pcePred_=pceEval(coefs=pceCoefs,xi=xiTest,distType=distType,kSet=kSet)
fPCE=pcePred_.pceVal
We can compare the estimated mean and varaince of \(f(q_1,q_2)\) with what we get from the Monte-Carlo approach:
[39]:
fEx_.moments(distType,qInfo)
fMean_mc=fEx_.mean
fVar_mc=fEx_.var
print('------------ MC -------- PCE --------- Error % ')
print('Mean of f(q) = %g\t%g\t%g' %(fMean_mc,fMean,(fMean-fMean_mc)/fMean_mc*100.))
print('Var  of f(q) = %g\t%g\t%g' %(fVar_mc,fVar,(fVar-fVar_mc)/fVar_mc*100.))
... Reference moments are calculated by the Monte-Carlo method with 100000 samples
------------ MC -------- PCE --------- Error %
Mean of f(q) = 0.343434 0.369846        7.69056
Var  of f(q) = 3.63372  3.61601 -0.487614
Finally, the response surface can be plotted.
[40]:
plot2d(nTest,qTest,fTest,q,fPCE)
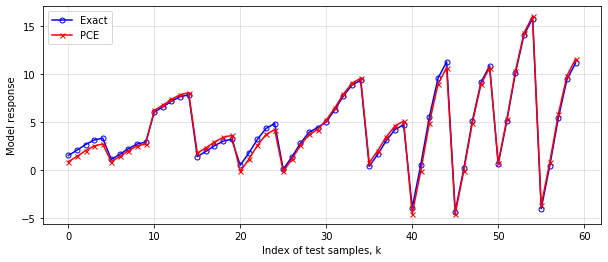
Example 5: gPCE for 3 uniformly distributed parameters
Consider the Ishigami function,
in which \(q_i\sim \mathcal{U}[\mathbb{Q}_i]\,,i=1,2,3\). The aim is to validate the estimated moments of \(f(\mathbf{q})\) by UQit with the analytical reference values.
[41]:
#Settings
distType=['Unif','Unif','Unif']   #distribution type of the parameters
qInfo=[[-0.75,1.5],               #range of parameters
       [-0.5,2.5],
       [ 1.0,3.0]]
nQ=[6,5,4]                        #number of parameter samples in the 3 dimensions
funOpt={'a':7,'b':0.1}            #parameters in the Ishigami function
#PCE options
truncMethod='TO'  #'TP'=Tensor Product
                  #'TO'=Total Order
sampleType='GQ'   #'GQ'=Gauss Quadrature nodes
                  #other types: see trainSample in sampling.py
pceSolveMethod='Regression' #'Regression': for any combination of sample points and truncation methods
                            #'Projection': only for 'GQ'+'TP'
nTest=[5,4,3]   #number of test samples for the parameters
if truncMethod=='TO':
   LMax=10   #max polynomial order in each parameter direction
#--------------------
p=len(distType)
#Assemble the pceDict
pceDict={'p':p,'truncMethod':truncMethod,'sampleType':sampleType,'pceSolveMethod':pceSolveMethod,
         'distType':distType}
if truncMethod=='TO':
   pceDict.update({'LMax':LMax})
#Generate training data
xi=[]
q=[]
qBound=[]
for i in range(p):
    samps=sampling.trainSample(sampleType=sampleType,GQdistType=distType[i],qInfo=qInfo[i],nSamp=nQ[i])
    xi.append(samps.xi)
    q.append(samps.q)
    qBound.append(samps.qBound)
fEx=analyticTestFuncs.fEx3D(q[0],q[1],q[2],'Ishigami','tensorProd',funOpt)
fVal=fEx.val
#Construct the PCE
xiGrid=reshaper.vecs2grid(xi)
pce_=pce(fVal=fVal,xi=xiGrid,pceDict=pceDict,nQList=nQ)
fMean=pce_.fMean
fVar=pce_.fVar
pceCoefs=pce_.coefs
kSet=pce_.kSet
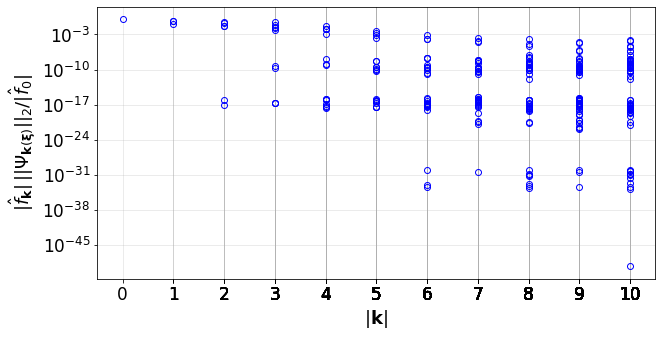
#Convergence of the PCE terms
convPlot(coefs=pceCoefs,distType=distType,kSet=kSet)
#Exact moments of the Ishigami function
fEx.moments(qInfo=qBound)
m=fEx.mean
v=fEx.var
#Compare the moments estimated by PCE with the exact analytical values
print(writeUQ.printRepeated('-',50))
print('\t\t Exact \t\t PCE')
print('E[f]:  ',m,fMean)
print('V[f]:  ',v,fVar)
print(writeUQ.printRepeated('-',50))
#Compare the PCE predictions at test points with the exact values of the model response
qTest=[]
xiTest=[]
for i in range(p):
    testSamps=sampling.testSample('unifSpaced',GQdistType=distType[i],qInfo=qInfo[i],qBound=qBound[i],nSamp=nTest[i])
    qTest.append(testSamps.q)
    xiTest.append(testSamps.xi)
fVal_test_ex=analyticTestFuncs.fEx3D(qTest[0],qTest[1],qTest[2],'Ishigami','tensorProd',funOpt).val
#PCE prediction at test points
pcePred_=pceEval(coefs=pceCoefs,xi=xiTest,distType=distType,kSet=kSet)
fVal_test_pce=pcePred_.pceVal
#Plot the exact and PCE response values
nTest_=np.prod(np.asarray(nTest))
fVal_test_pce_=fVal_test_pce.reshape(nTest_,order='F')
err=np.linalg.norm(fVal_test_pce_-fVal_test_ex)
plt.figure(figsize=(10,4))
plt.plot(fVal_test_pce_,'-ob',mfc='none',ms=5,label='Exact')
plt.plot(fVal_test_ex,'-xr',ms=5,label='PCE')
plt.xlabel('Index of test samples, k')
plt.ylabel('Model response')
plt.legend(loc='best')
plt.grid(alpha=0.4)
plt.show()
... A gPCE for a 3-D parameter space is constructed.
...... PCE truncation method: TO
...... Method of computing PCE coefficients: Regression
         with LMax=10 as the max polynomial order in each direction.
...... Number of terms in PCE, K=  286
...... Number of Data point, n=  120
-----------------------------------------------------------------
           OSQP v0.6.0  -  Operator Splitting QP Solver
              (c) Bartolomeo Stellato,  Goran Banjac
        University of Oxford  -  Stanford University 2019
-----------------------------------------------------------------
problem:  variables n = 572, constraints m = 858
          nnz(P) + nnz(A) = 81786
settings: linear system solver = qdldl,
          eps_abs = 1.0e-05, eps_rel = 1.0e-05,
          eps_prim_inf = 1.0e-04, eps_dual_inf = 1.0e-04,
          rho = 1.00e-01 (adaptive),
          sigma = 1.00e-06, alpha = 1.60, max_iter = 100000
          check_termination: on (interval 25),
          scaling: on, scaled_termination: off
          warm start: on, polish: on, time_limit: off

iter   objective    pri res    dua res    rho        time
   1  -2.2880e+03   5.06e+02   2.16e+05   1.00e-01   2.81e-02s
 200   2.6270e+01   1.27e-02   1.50e-03   1.00e-01   8.49e-02s
 300   2.6288e+01   4.53e-03   1.82e-05   1.00e-01   1.16e-01s

status:               solved
solution polish:      unsuccessful
number of iterations: 300
optimal objective:    26.2884
run time:             1.37e-01s
optimal rho estimate: 2.32e-01

...... Compressed sensing (regularization) is done.
       Min objective value=||fHat||= 26.2884 in L1-sense.
--------------------------------------------------
                 Exact           PCE
E[f]:   4.573160953235525 4.573189774327447
V[f]:   11.562474905206148 11.517012062432517
--------------------------------------------------
