Lagrange Interpolation
Saleh Rezaeiravesh, salehr@kth.se SimEx/FLOW, Engineering Mechanics, KTH Royal Institute of Technology, Stockholm, Sweden
[1]:
import os
import sys
import numpy as np
import matplotlib
import matplotlib.pyplot as plt
from UQit.lagInt import lagInt, lagInt_Quads2Line
import UQit.analyticTestFuncs as analyticTestFuncs
import UQit.sampling as sampling
import UQit.pce as pce
import UQit.reshaper as reshaper
Example 1: Lagrange interpolation over a 1D parameter space.
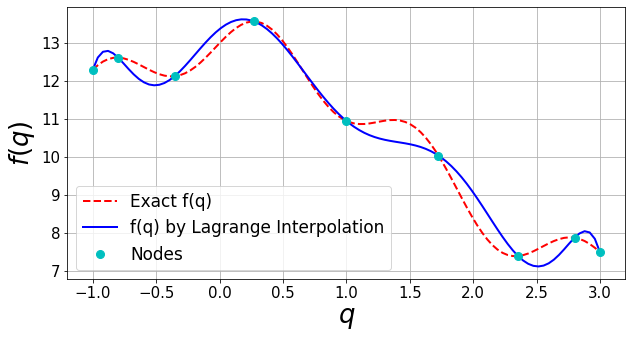
Consider a model function that only depends on one uncertain parameter \(q_1\in \mathbb{Q}_1\). The aim is to construct a 1D Lagrange interpolation based on a limited number of samples drawn from \(\mathbb{Q}_1\). UQit provides different methods for drawing samples via sampling.trainSample for an uncertain parameter, and of course it can handle any arbitrary set of samples which are provided by the user.
The model function is defied as,
Given samples for \(q_1\), the values of this function can be generated via analyticTestFuncs.fEx1D(typ='type1'). To construct the Lagrange interpolation using the data, we take the following steps:
Step 1: Set the settings; we set the number of nodes (parameter samples), the admissible space of the parameters \(\mathbb{Q}_1\), how the samples are drawn (if using trainSample), and the number of test points in the parameter space at which the constructed Lagrange interpolation is evaluated.
[2]:
nNodes=9          #number of training samples (nodes)
qBound=[-1,3]     #range over which the samples are taken
nTest=100         #number of test points
sampType='GLL'    #Type of samples, see trainSample class in sampling.py
Step 2: Draw samples for the parameter and run the simulator at each sample (generate training data).
[3]:
samps_=sampling.trainSample(sampleType=sampType,qInfo=qBound,nSamp=nNodes)
qNodes=samps_.q
fNodes=analyticTestFuncs.fEx1D(qNodes,'type1',qBound).val
Step 3: Generate the test samples.
[4]:
qTestFull=np.linspace(qBound[0],qBound[1],nTest)
qTest=np.linspace(min(qNodes),max(qNodes),nTest)
Step 4: Construct the Lagrange interpolation and evaluate it at the test points.
[5]:
fInterpTest=lagInt(fNodes=fNodes,qNodes=[qNodes],qTest=[qTest]).val
Step 5: Plot and validation.
[6]:
fTestFull=analyticTestFuncs.fEx1D(qTestFull,'type1',qBound).val
plt.figure(figsize=(10,5))
plt.plot(qTestFull,fTestFull,'--r',lw=2,label='Exact f(q)')
plt.plot(qTest,fInterpTest,'-b',lw=2,label='f(q) by Lagrange Interpolation')
plt.plot(qNodes,fNodes,'oc',markersize='8',label='Nodes')
plt.legend(loc='best',fontsize=17)
plt.xticks(fontsize=15)
plt.yticks(fontsize=15)
plt.grid()
plt.xlabel(r'$q$',fontsize=26)
plt.ylabel(r'$f(q)$',fontsize=26)
plt.show()

Extra: There are different factors that control the accuracy of a Lagrange interpolation. These include the number of training samples (nodes) and how they are generated. Try to rerun the above example adopting different values for nNodes and sampType. Here is the list of available sampType in sampling.trainSample:
['GQ','GLL','unifSpaced','unifRand','normRand','Clenshaw','Clenshaw-Curtis']
Example 2: Lagrange interpolation over a 2D parameter space.
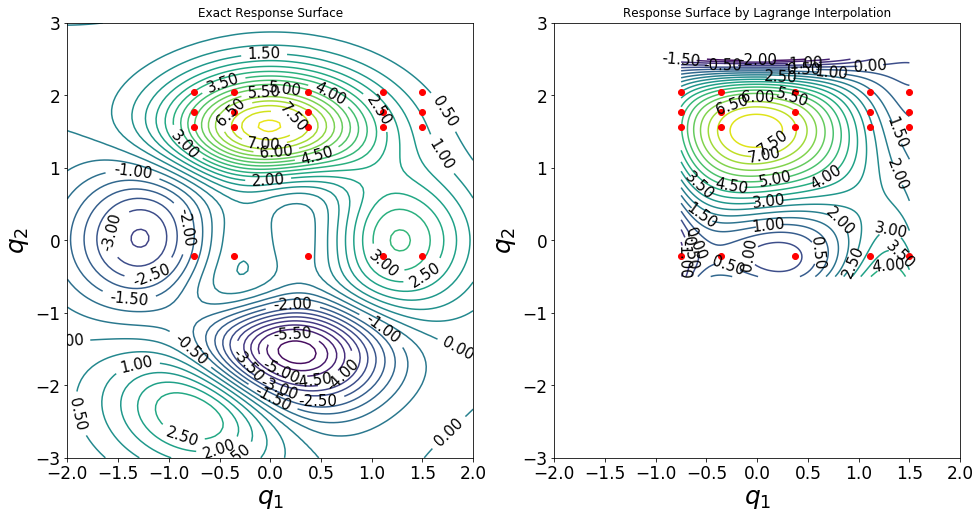
Consider a model function which depends on parameters \(q_1\in \mathbb{Q}_1\) and \(q_2\in\mathbb{Q}_2\). Let \(\mathbb{Q}^*_1\bigotimes\mathbb{Q}^*_2\) be a subspace of \(\mathbb{Q}_1\bigotimes\mathbb{Q}_2\). Through a few number of samples taken from \(\mathbb{Q}^*_1\bigotimes\mathbb{Q}^*_2\) and constructing a Lagrange interpolation, we want to reconstruct the response surface.
As the model function (simulator), we consider
which is implemented in UQit in analyticTestFuncs.fEx2D() with keyword type1.
Step 1: Settings
[7]:
nNodes=[5,4]          #number of  training samples nodes in space of parameters q1, q2
sampType=['GLL',      #Method of drawing samples for q1, q2
          'unifRand']
qBound=[[-0.75,1.5],  # admissible range of parameters, Q*_1, Q*_2
        [-0.5 ,2.5]]

# Settings of the exact response surface
domRange=[[-2,2], #Q_1, Q_2, domain range for q1, q2
          [-3,3]]
nTest=[100,101] #number of test samples
Step 2: Create the training samples over each parameter space
[8]:
p=len(nNodes)
qNodes=[]
for i in range(p):
    qNodes_=sampling.trainSample(sampleType=sampType[i],qInfo=qBound[i],nSamp=nNodes[i])
    qNodes.append(qNodes_.q)
Step 3: Evaluate the simulator at each joint sample
[9]:
fNodes=analyticTestFuncs.fEx2D(qNodes[0],qNodes[1],'type1','tensorProd').val
Step 4: Generate the test samples
[10]:
qTestList=[]
for i in range(p):
    qTest_=sampling.testSample(sampleType='unifSpaced',qBound=qBound[i],nSamp=nTest[i])
    qTestList.append(qTest_.q)
Step 5: Construct the Lagrange interpolation and evaluate it at the test samples
[11]:
fTest=lagInt(fNodes=fNodes,qNodes=qNodes,qTest=qTestList,liDict={'testRule':'tensorProd'}).val
Step 5: Plot the original and interpolated response surfaces.
[12]:
# Evaluate the exact model response over domRange
qTestFull=[]
for i in range(p):
    qTestFull_=np.linspace(domRange[i][0],domRange[i][1],nTest[i])
    qTestFull.append(qTestFull_)
fTestFull=analyticTestFuncs.fEx2D(qTestFull[0],qTestFull[1],'type1','tensorProd').val
fTestFullGrid=fTestFull.reshape((nTest[0],nTest[1]),order='F').T
fTestGrid=fTest.reshape((nTest[0],nTest[1]),order='F').T
# Plots
plt.figure(figsize=(16,8));
plt.subplot(1,2,1)
ax=plt.gca()
CS1 = plt.contour(qTestFull[0],qTestFull[1],fTestFullGrid,35)
plt.clabel(CS1, inline=True, fontsize=15,colors='k',fmt='%0.2f',rightside_up=True,manual=False)
qNodesGrid=reshaper.vecs2grid(qNodes)
plt.plot(qNodesGrid[:,0],qNodesGrid[:,1],'o',color='r',markersize=6)
plt.xlabel(r'$q_1$',fontsize=25);plt.ylabel(r'$q_2$',fontsize=25);
plt.xticks(fontsize=17)
plt.yticks(fontsize=17)
plt.title('Exact Response Surface')
plt.subplot(1,2,2)
ax=plt.gca()
CS2 = plt.contour(qTestList[0],qTestList[1],fTestGrid,20)
plt.clabel(CS2, inline=True, fontsize=15,colors='k',fmt='%0.2f',rightside_up=True,manual=False)
plt.plot(qNodesGrid[:,0],qNodesGrid[:,1],'o',color='r',markersize=6)
plt.xlabel(r'$q_1$',fontsize=25);plt.ylabel(r'$q_2$',fontsize=25);
plt.xticks(fontsize=17)
plt.yticks(fontsize=17)
plt.title('Response Surface by Lagrange Interpolation')
plt.xlim(domRange[0])
plt.ylim(domRange[1])
plt.show()

Extra: Try different types and numbers of training samples for parameters \(q_1\) and \(q_2\).
Example 3: Lagrange interpolation over a 3D parameter space.
Consider the Ishigami function,
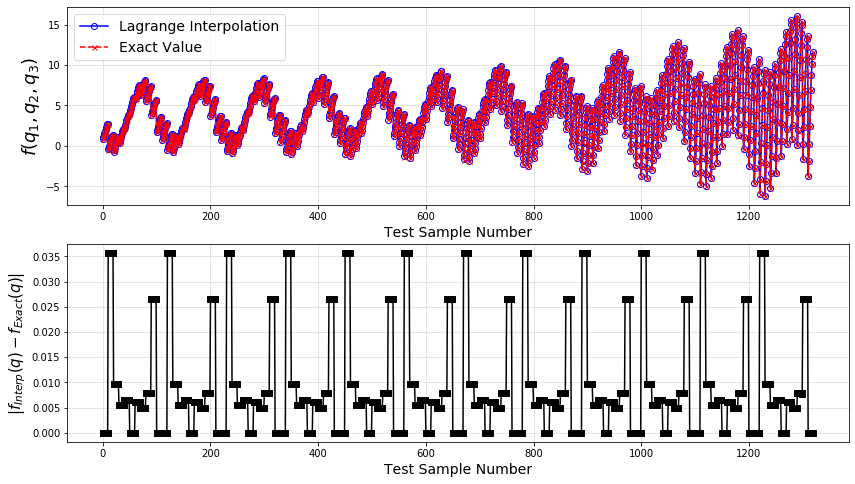
where \(q_i\in \mathbb{Q}_i\,,i=1,2,3\). We want to find the error between the actual function values and what prediction by the Lagrange interpolation constructed based on a limited number of samples.
We follow the same steps as in the previous examples:
[13]:
#----- SETTINGS -------------------
nNodes=[8,7,6]         #number of training samples for q1, q2, q3
sampType=['GLL',       #Type of samples for q1, q2, q3
          'unifSpaced',
          'Clenshaw']
qBound=[[-0.75,1.5],   #range of parameters q1, q2, q3
        [-0.5 ,2.5],
        [1,3]]
nTest=[10,11,12]       #number of test samples for q1, q2, q3
fOpts={'a':7,'b':0.1}  #parameters in Ishigami function
#----------------------------------
p=len(nNodes)
# Generate the training samples
qNodes=[]
for i in range(p):
    qNodes_=sampling.trainSample(sampleType=sampType[i],qInfo=qBound[i],nSamp=nNodes[i])
    qNodes.append(qNodes_.q)
# Run the simulator at the training samples
fNodes=analyticTestFuncs.fEx3D(qNodes[0],qNodes[1],qNodes[2],'Ishigami','tensorProd',fOpts).val
# Create the test samples and run the simultor at them
qTest=[]
for i in range(p):
    qTest_=sampling.testSample(sampleType='unifSpaced',qBound=qBound[i],nSamp=nTest[i])
    qTest.append(qTest_.q)
fTestEx=analyticTestFuncs.fEx3D(qTest[0],qTest[1],qTest[2],'Ishigami','tensorProd',fOpts).val
# Construct the Lagrange interpolation an evaluate it at the test samples
fInterp=lagInt(fNodes=fNodes,qNodes=qNodes,qTest=qTest,liDict={'testRule':'tensorProd'}).val
# Plot
plt.figure(figsize=(14,8))
plt.subplot(2,1,1)
fInterp_=fInterp.reshape(np.asarray(np.prod(np.asarray(nTest))),order='F')
plt.plot(fInterp_,'-ob',mfc='none',label='Lagrange Interpolation')
plt.plot(fTestEx,'--xr',ms=5,label='Exact Value')
plt.ylabel(r'$f(q_1,q_2,q_3)$',fontsize=18)
plt.xlabel(r'Test Sample Number',fontsize=14)
plt.legend(loc='best',fontsize=14)
plt.grid(alpha=0.4)
plt.subplot(2,1,2)
plt.plot(abs(fInterp_-fTestEx),'-sk')
plt.ylabel(r'$|f_{Interp}(q)-f_{Exact}(q)|$',fontsize=15)
plt.xlabel(r'Test Sample Number',fontsize=14)
plt.grid(alpha=0.4)
plt.show()

Clearly, the error between the exact values of the Ishigami function and the values obtained by the Lagrange interpolation constructed from a limited number of samples is very small. One can investigate how different number and type of the training samples would influence the accuracy of the resulting interpolation.