Gaussian Process Regression (GPR)
Saleh Rezaeiravesh, salehr@kth.se SimEx/FLOW, Engineering Mechanics, KTH Royal Institute of Technology, Stockholm, Sweden
The aim of this notebook is to shortly show how one can construct a GPR over the space of the uncertain parameters in UQit. This is currently being done using `GPyTorch <https://docs.gpytorch.ai/en/v1.2.0/>`__. So, one can directly look at the `GPyTorch <https://docs.gpytorch.ai/en/v1.2.0/>`__ tutorial.
[1]:
import os
import sys
import numpy as np
import math as mt
from matplotlib import pyplot as plt
import torch
import gpytorch
from UQit.gpr_torch import gpr, gprPost, gprPlot
import UQit.analyticTestFuncs as analyticTestFuncs
import UQit.reshaper as reshaper
import UQit.sampling as sampling
Example 1: Single-task GPR over a 1D parameter space
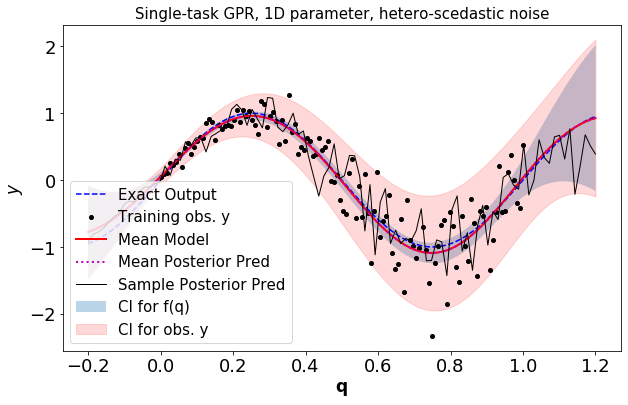
Consider the simulator \(f(q)\) where \(q\in \mathbb{Q}\subset \mathbb{R}\). The aim is to construct a GPR given a set of noisy training samples. In particular, we would like to observe the difference between the homoscedastic and heteroscedastic noises.
First, we need a set of functions for generating synthetic training data:
[2]:
def fEx(x):
    """Simulator"""
    yEx=np.sin(2*mt.pi*x)
    return yEx
def noiseGen(n,noiseType):
    """Generate a 1D numpy array of standard deviations of the observation noise"""
    if noiseType=='homo':
       sd=0.2   #standard deviation (Note: non-zero, to avoid instabilities)
       sdV=[sd]*n
       sdV=np.asarray(sdV)
    elif noiseType=='hetero':
       sdMin=0.05
       sdMax=0.55
       sdV=sdMin+(sdMax-sdMin)*np.linspace(0.0,1.0,n)
    return sdV
def trainData(xBound,n,noiseType):
    """Create training data D={X,Y}"""
    x=np.linspace(xBound[0],xBound[1],n)
    sdV=noiseGen(n,noiseType)
    y=fEx(x) + sdV * np.random.randn(n)
    return x,y,sdV
Different options for the GPR can be set as below.
[3]:
n=120           #number of training samples
nTest=100       #number of test samples
xBound=[0.,1]   #parameter range
#Type of the noise
noiseType='hetero'   #'homo'=homoscedastic, 'hetero'=heterscedastic
nIter_=1000           #number of iterations in optimization of GPR hyperparameters
lr_   =0.1           #learning rate in the optimization of the hyperparameters
convPlot_=True       #plot convergence of optimization of the GPR hyperparameters
Assmeble the gprOpts dict, and then generate the training data and test samples.
[4]:
#(0) Assemble gprOpts dictionary
gprOpts={'nIter':nIter_,'lr':lr_,'convPlot':convPlot_}
#(1) Generate training and test samples
xTrain,yTrain,noiseSdev=trainData(xBound,n,noiseType)
xTest = np.linspace(xBound[0]-0.2, xBound[1]+.2, nTest)
Construct the GPR using the training data
[5]:
gpr_=gpr(xTrain=xTrain[:,None],yTrain=yTrain[:,None],noiseV=noiseSdev,
         xTest=xTest[:,None],gprOpts=gprOpts)
post_f=gpr_.post_f
post_obs=gpr_.post_y
...... GPR-hyperparameters Optimization, iter 1/1000 - loss: 0.954 - lengthsc: 0.644
...... GPR-hyperparameters Optimization, iter 100/1000 - loss: 0.158 - lengthsc: 0.301
...... GPR-hyperparameters Optimization, iter 200/1000 - loss: 0.158 - lengthsc: 0.294
...... GPR-hyperparameters Optimization, iter 300/1000 - loss: 0.157 - lengthsc: 0.290
...... GPR-hyperparameters Optimization, iter 400/1000 - loss: 0.153 - lengthsc: 0.287
...... GPR-hyperparameters Optimization, iter 500/1000 - loss: 0.152 - lengthsc: 0.287
...... GPR-hyperparameters Optimization, iter 600/1000 - loss: 0.152 - lengthsc: 0.287
...... GPR-hyperparameters Optimization, iter 700/1000 - loss: 0.152 - lengthsc: 0.287
...... GPR-hyperparameters Optimization, iter 800/1000 - loss: 0.152 - lengthsc: 0.287
...... GPR-hyperparameters Optimization, iter 900/1000 - loss: 0.152 - lengthsc: 0.287
...... GPR-hyperparameters Optimization, iter 1000/1000 - loss: 0.152 - lengthsc: 0.286

Plot the GPR, training data, a sample from the posterior of the GPR:
[6]:
fExTest=fEx(xTest)  #exact model response
pltOpts={'title':'Single-task GPR, 1D parameter, %s-scedastic noise'%noiseType}
gprPlot(pltOpts).torch1d(post_f,post_obs,xTrain,yTrain,xTest,fExTest)
Example 2: GPR over a 2D parameter space
Consider \(\mathbf{q}\in\mathbb{Q}\subset \mathbb{R}^2\). The aim is to construct a GPR given a set of noisy training samples. In particular, we would like to observe the difference between the homoscedastic and heteroscedastic noises.
First, we need a set of functions for generating synthetic training data. The simulator can be any of the existing models in analyticTestFuncs.fEx2D.
[7]:
def plot_trainData(n,fSamples,noiseSdev,yTrain):
    """Plot the noisy training data which are used in GPR"""
    plt.figure(figsize=(10,5))
    x_=np.zeros(n)
    for i in range(n):
        x_[i]=i+1
    for i in range(500):  #only for plottig possible realizations
        noise_=noiseSdev*np.random.randn(n)
        plt.plot(x_,fSamples+noise_,'.',color='steelblue',alpha=0.4,markersize=1)
    plt.errorbar(x_,fSamples,yerr=1.96*abs(noiseSdev),ls='none',capsize=5,ecolor='k',
            elinewidth=4,label=r'$95\%$ CI in Obs.')
    plt.plot(x_,fSamples,'o' ,markersize=6,markerfacecolor='lime',
             markeredgecolor='salmon',label='Mean Observation')
    plt.plot(x_,yTrain ,'xr' ,markersize=6,label='Sample Observation')
    plt.legend(loc='best',fontsize=15)
    plt.ylabel('QoI',fontsize=17)
    plt.xlabel('Simulation Index',fontsize=17)
    plt.xticks(fontsize=15)
    plt.yticks(fontsize=15)
    plt.title('Training data with associated confidence')
    plt.show()

def trainDataGen(p,sampleType,n,qBound,fExName,noiseType):
    """Generate Training Data"""
    #  (a) xTrain
    if sampleType=='grid':
       nSamp=n[0]*n[1]
       gridList=[]
       for i in range(p):
           grid_=np.linspace(qBound[i][0],qBound[i][1],n[i])
           gridList.append(grid_)
       xTrain=reshaper.vecs2grid(gridList)
    elif sampleType=='random':
         nSamp=n     #number of random samples
         xTrain=sampling.LHS_sampling(n,qBound)
    #  (b) Observation noise
    noiseSdev=noiseGen(nSamp,noiseType,xTrain,fExName)
    #  (c) Training response
    yTrain=analyticTestFuncs.fEx2D(xTrain[:,0],xTrain[:,1],fExName,'comp').val
    yTrain_noiseFree=yTrain
    yTrain=yTrain_noiseFree+noiseSdev*np.random.randn(nSamp)
    return xTrain,yTrain,noiseSdev,yTrain_noiseFree

def noiseGen(n,noiseType,xTrain,fExName):
    """
    Generate a 1D numpy array of standard deviations of the observation noise
    """
    if noiseType=='homo':
       sd=0.2   #(Note: non-zero, to avoid instabilities)
       sdV=sd*np.ones(n)
    elif noiseType=='hetero':
       sdV=0.1*(analyticTestFuncs.fEx2D(xTrain[:,0],xTrain[:,1],fExName,'comp').val+0.001)
    return sdV
In the following settings, we can choose different model functions as the simulator, different types of sampling methods, different types of observation noise (homoscedastic or heteroscedastic), and etc.
[8]:
qBound=[[-2,2],[-2,2]]   #Admissible range of parameters
fExName='type1'          #Type of simulator in analyticTestFuncs.fEx2D
                         #'type1', 'type2', 'type3', 'Rosenbrock'
sampleType='random'      #'random' or 'grid': type of training samples
if sampleType=='grid':
   n=[9,9]               #number of training samples in each input dimension
elif sampleType=='random':
   n=100                 #total number of training samples drawn randomly
noiseType='hetero'       #noise type: 'homo'=homoscedastic, 'hetero'=heterscedastic
#options for GPR
nIter_=1500        #number of iterations in optimization of GPR hyperparameters
lr_   =0.1         #learning rate in the optimization of the hyperparameters
convPlot_=True     #plot convergence of optimization of GPR hyperparameters
nTest=[31,30]      #number of test points in each parameter dimension
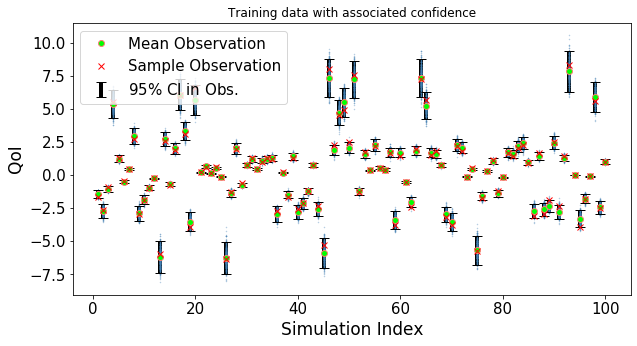
Generate training data and plot the uncertainty in the observations
[9]:
#(0) Assemble the gprOpts dict
gprOpts={'nIter':nIter_,'lr':lr_,'convPlot':convPlot_}
#(1) Generate training data
p=len(qBound)    #dimension of the input
xTrain,yTrain,noiseSdev,yTrain_noiseFree=trainDataGen(p,sampleType,n,qBound,fExName,noiseType)
nSamp=yTrain.shape[0]
plot_trainData(nSamp,yTrain_noiseFree,noiseSdev,yTrain)
Generate test samples
[10]:
xTestList=[]
for i in range(p):
    grid_=np.linspace(qBound[i][0],qBound[i][1],nTest[i])
    xTestList.append(grid_)
xTest=reshaper.vecs2grid(xTestList)
Construct the GPR and make predictions at the test samples
[11]:
gpr_=gpr(xTrain,yTrain[:,None],noiseSdev,xTest,gprOpts)
post_f=gpr_.post_f
post_obs=gpr_.post_y
...... GPR-hyperparameters Optimization, iter 1/1500 - loss: 1.780  lengthscales=0.644 0.644
...... GPR-hyperparameters Optimization, iter 100/1500 - loss: 0.903  lengthscales=0.707 0.644
...... GPR-hyperparameters Optimization, iter 200/1500 - loss: 0.893  lengthscales=0.724 0.665
...... GPR-hyperparameters Optimization, iter 300/1500 - loss: 0.891  lengthscales=0.733 0.674
...... GPR-hyperparameters Optimization, iter 400/1500 - loss: 0.890  lengthscales=0.737 0.680
...... GPR-hyperparameters Optimization, iter 500/1500 - loss: 0.890  lengthscales=0.740 0.683
...... GPR-hyperparameters Optimization, iter 600/1500 - loss: 0.890  lengthscales=0.741 0.684
...... GPR-hyperparameters Optimization, iter 700/1500 - loss: 0.890  lengthscales=0.742 0.685
...... GPR-hyperparameters Optimization, iter 800/1500 - loss: 0.890  lengthscales=0.742 0.686
...... GPR-hyperparameters Optimization, iter 900/1500 - loss: 0.890  lengthscales=0.742 0.686
...... GPR-hyperparameters Optimization, iter 1000/1500 - loss: 0.890  lengthscales=0.742 0.686
...... GPR-hyperparameters Optimization, iter 1100/1500 - loss: 0.890  lengthscales=0.742 0.686
...... GPR-hyperparameters Optimization, iter 1200/1500 - loss: 0.890  lengthscales=0.742 0.686
...... GPR-hyperparameters Optimization, iter 1300/1500 - loss: 0.890  lengthscales=0.742 0.686
...... GPR-hyperparameters Optimization, iter 1400/1500 - loss: 0.890  lengthscales=0.742 0.686
...... GPR-hyperparameters Optimization, iter 1500/1500 - loss: 0.890  lengthscales=0.742 0.686

[12]:
#Predicted mean and variance of the posteriors at the test grid
fP_=gprPost(post_f,nTest)
fP_.torchPost()
post_f_mean=fP_.mean
post_f_sdev=fP_.sdev
obsP_=gprPost(post_obs,nTest)
obsP_.torchPost()
post_obs_mean=obsP_.mean
post_obs_sdev=obsP_.sdev
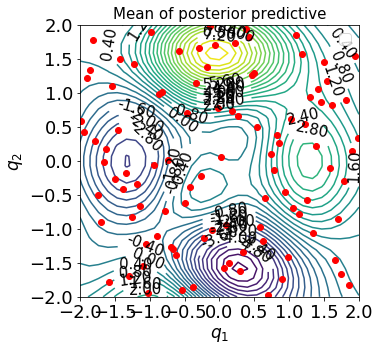
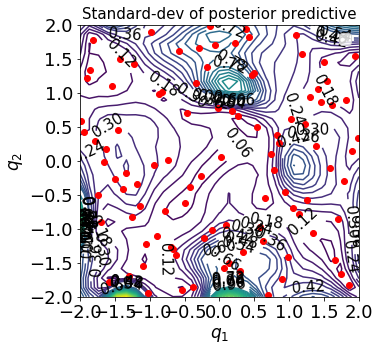
We can plot the contours of the mean and standard-deviation of the posterior and posterior predictive of the resulting GPR in the admissible space of \(\mathbb{Q}_1\bigotimes\mathbb{Q}_2\):
[13]:
pltOpts={'title':'Mean of posterior predictive','xlab':r'$q_1$','ylab':r'$q_2$'}
gprPlot(pltOpts).torch2d_2dcont(xTrain,xTestList,post_obs_mean)
No handles with labels found to put in legend.
[14]:
pltOpts={'title':'Standard-dev of posterior predictive','xlab':r'$q_1$','ylab':r'$q_2$'}
gprPlot(pltOpts).torch2d_2dcont(xTrain,xTestList,post_obs_sdev)
No handles with labels found to put in legend.
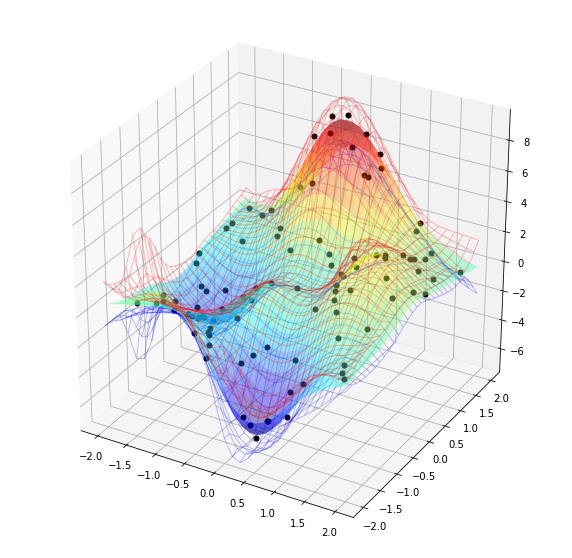
We can also make a 3D plot, see below. The colored surface represents the mean of the posterior and the red and blue mesh surfaces respectively show the upper and lower 95% confidence intervals.
[15]:
gprPlot().torch2d_3dSurf(xTrain,yTrain,xTestList,post_obs)
